Data analytics is a process, where information is gathered, modeled and interpreted, with the end goal of providing insights and implications for the business decision-making.
Data project pipeline
To be successful in it, we must approach a data project in a methodical way. There is a sequence of steps—a data project pipeline with four general tasks: (1) project planning, (2) data preparation, (3) modeling and analysis, (4) follow up and production.
While project planning is usually a natural way to start—people understand the need of defining of the goals, organizing resources, coordination and scheduling—the data preparation step is quite too left out, or marginalized.
Cleansing is understanding
Yes, data is messy and dirty and must be cleansed. We also need to prepare it to fit into the model, check for anomalies and make sure is valid, reliable and meaningful for our analytical goals. A good way to start is asking some basic questions: What are the data types? How many scales of measurement can we identify? How do the data distributions look like? Do we have enough of high quality independent and dependent variables? Finally, we refine the data set. To assure the depth of the analysis, we must choose the cases to include, the variables to be used. Equally important, we decide on what not to include—the bad or incomplete data, that will clutter and taint our analytics.
Understanding and intelligent data preparation is a daunting task, but can be done. What may come in handy, is a data preparation tool—from a simple Excel spreadsheet, to a heavy-duty self-service data integration platform—the market offers an increasing selection of tools. To illustrate the preparation process, we will use Informatica’ s Intelligent Data Lake (IDL) visual interface.
Less is more
As a demonstration, we ingest sales and customer data from one of the national book stores. In the first step, we familiarize ourselves with the type of data we are dealing with.
We start to understand how much data comes in as text, where are the numbers, and what qualifies as personal data: addresses, emails etc. In this case, we also found three columns filled with single values only—they provide no meaning for our analytics, it is either junk or system descriptors load data. The other two are blank, and just occupy space. We’ll be better of hiding them from our and other’s eyes—the less is more!

Understanding the measurement scales
There are different levels, or scales of measurement, classified into four categories: nominal, ordinal, interval and ratio. It is important to understand our data through the lenses of the measurement levels, as they will play a part in determining the arithmetic and the statistical operations that can be carried on them. In the nominal scale numbers are used to classify the data—words and letters can be used. In our example, book categories variable has a nominal scale. A quick analysis gives as a better understanding of the value frequencies between them. We also find, one of the types, “Video Games”, is misspelled—should be corrected to conform with “Video Game” categories.

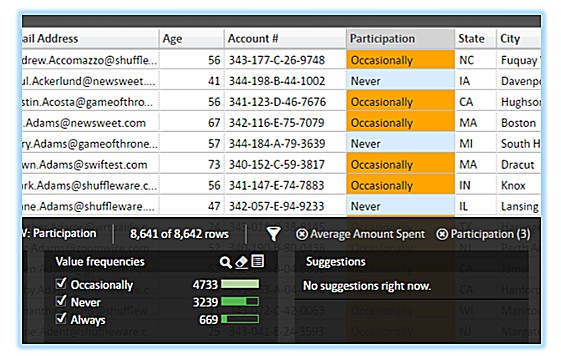
Ordinal level depicts some ordered relationship between the items, and indicates an approximate ordering of the measurements. In our case, the customer Participation attributes are ranked: Never, Occasionally, Always. When doing further statistical responsive modeling, or simply visualizing the participation in Tableau’s charts, we ought to understand its dependencies and use the appropriate hierarchical visualization.
Data distribution and anomalies
The Age variable could be a candidate for an interval scale measurement, where the distance between each data point is equal. We look into a distribution of data (a histogram chart below), the mean and standard deviation.

Lastly, the Average Amount, which represents the ratio measurement scale, shows anomalies. After a closer examination of its distribution (the tool come in handy here), we determine the top 20% consists of a single item only carrying an unexpectedly high value of over $2.6M—most likely a data entry or processing error. At this point, we either stop and ask the data owners to refine it, continue our analysis excluding this case, or temporarily fix it—assuming we understand the nature of the mistake (e.g. extra ,000 in the number).
The methodical approach to data projects, with a proper level attention to preparation and cleansing, helps build credibility around data and provide high quality and well understood assets for the interpretation, modeling, influence analysis and insights.
“In God we trust, all others must bring the data” – whether we agree or not with E. Deming here, bringing clean data benefits everybody.

If you are interested, please follow our blogs; we are planning to cover building the data models, associations and other frequently used techniques in high impact data analytics projects.